Nvidia delivered better than gexpected Q2 2026 earnings with revenue of $46.7 billion and adjusted EPS of $1.05, yet shares fell over 3% in after-hours trading as data center revenue came up slightly short for the second consecutive quarter.
After Trump's tariff announcement triggered Wall Street's most severe sell-off, US stock market trends show a surprising comeback. What's driving financial markets and what should investors expect from Dow Jones stocks?
In a bombshell announcement at the Berkshire Hathaway annual meeting, the 94-year-old "Oracle of Omaha" revealed he'll step down as CEO by year-end 2025, with Greg Abel taking the reins of the $1.1 trillion empire.
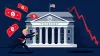
US Stock Market's Extraordinary Rebound After Trump's Tariff Shock
After Trump's tariff announcement triggered Wall Street's most severe sell-off, US stock market trends show a surprising comeback. What's driving financial markets and what should investors expect from Dow Jones stocks?
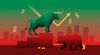
Bull triumphant over bear: US stock market rebounds after tariff shock, with S&P 500 achieving longest winning streak in 20 years despite persistent investor caution.
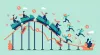
Wall Street's pulling off something I haven't seen since the post-COVID rally of 2020. A comeback that's left even the most seasoned traders scratching their heads. After Trump dropped his tariff bombshell on April 2, the Dow Jones and S&P 500 went into freefall. Then, boom. A reversal that's pushed the S&P to its longest winning streak in two decades. I've spent 15 years watching market corrections, and this one's breaking all the usual recovery patterns. Let me walk you through what's really happening with US equities right now, and why the financial news headlines aren't telling you the complete story about this remarkable turnaround.
DISCLAIMER This article does not constitute financial advice, it provides general information and analysis only. Neither AQ Media nor the authors are licensed financial advisors. Readers should always do their own research and due diligence, review multiple sources and in some circumstances consult a qualified financial professional within their country/state of residence before making decisions about their financial matters. Past performance is no guarantee of future results
When Trump unveiled his "Liberation Day" tariff plan on April 2, the market reaction hit like a sledgehammer. I was on a call with three institutional clients when the news broke, and we all watched in disbelief as the selling accelerated. Over just seven trading days, the S&P 500 nosedived more than 12%. That's panic-button territory, folks. The kind of plunge we typically only see during full-blown crises like 2008 or March 2020.
This was the fifth-worst two-day percentage decline since World War II. I've never seen institutional selling this aggressive outside of a banking crisis. Deutsche Bank's trading desk called the moves "truly historic in their speed." By mid-April, the S&P had cratered to 19% below its all-time high, with the Dow Jones Industrial Average showing similar weakness. We were literally one bad day away from the 20% threshold that officially triggers bear market headlines.
What really sent chills through my network of Wall Street contacts wasn't just the equity sell-off. It was seeing government bond yields spike simultaneously. In normal corrections, you'd expect a flight to safety pushing Treasury yields lower. Instead, we got the worst of both worlds: stocks tanking while borrowing costs rose. During my time at a major investment bank in 2013, we had a term for this toxic combination: "nowhere to hide" markets.
The Critical Turning Point
The whole script flipped on April 9. Trump announced a 90-day suspension of his "reciprocal tariffs" for most countries (except China, notably). Wall Street responded like a starving person at a buffet:
Dow Jones Industrial Average: +2,963 points (7.9%)
S&P 500: +474 points (9.5%)
Nasdaq Composite: +1,857 points (12.2%)
I was texting with a former colleague who manages a $3 billion macro fund, and he simply wrote: "Have you EVER seen anything like this?" He's been trading since the 90s. The data from FactSet confirmed what we were feeling: this was the S&P's biggest one-day gain since October 2008, during the financial crisis. The Nasdaq hadn't jumped this much in a single session since 2001.
But here's where it got messy. The next day, markets puked back a big chunk of those gains. S&P down 3.46%, Nasdaq sliding 4.31%, and the Dow dropping over 1,000 points. Classic bull trap behavior. I've seen this movie before. Back in Hong Kong during the 2015 market turmoil, we'd get these massive up days that would sucker in retail traders, only to see institutions dump their inventory the next session. Never trust a one-day wonder without confirmation.
Current Stock Index Status
Fast forward 32 days after Trump's Rose Garden speech. The recovery that almost nobody on the Street predicted has materialized in spectacular fashion. The S&P 500 just completed its first nine-day winning streak since November 2004. Think about that. We haven't seen a run like this in over 20 years. According to my contacts at the Dow Jones Market Data team, the eight trading days through last Thursday delivered the biggest gain for the S&P since November 2020, when vaccines first gave us hope the pandemic might end.
This rebound has essentially erased all the post-"Liberation Day" damage. The S&P, which was bleeding out at 15% down year-to-date in mid-April, has clawed back to just 4% down for 2025. The broader market has basically returned to pre-tariff announcement levels.
But here's where my Silicon Valley contacts provide insights you won't get from CNBC. The market narrative misses three critical factors:
This recovery is wildly uneven across sectors (tech leading, utilities lagging)
US stock market indexes remain roughly 6% below their pre-Inauguration Day levels
Some major bellwethers are still in serious pain mode (Apple down 20% from winter peak; Tesla, despite Musk's Trump alliance, down a brutal 40% from December)
So what's really going on here? After talking with my network of fund managers and taking a deep dive into the data, I've identified three key factors powering this remarkable rebound:
1. Softening Rhetoric on Trade Policy
The obvious catalyst was Trump walking back the immediate threat. By hitting pause for 90 days on most countries, he created breathing room that Wall Street desperately needed. Markets hate uncertainty more than bad news, and this move at least gave traders a timeframe to work with. It's exactly what I saw during the 2018-2019 trade tensions when each "delay" announcement boosted markets 2-3%.
2. Retail Investor Influence
Here's the wildcard nobody's talking about enough. Retail investors are absolutely dominating this recovery. According to fresh Vanguard data, "bulls" crushed "bears" by nearly 4-to-1 among self-directed investors in April. The Vanguard ETF pulled in a staggering $21 billion last month. That's not just a record for the fund's 15-year history; it's the fifth-largest monthly inflow for ANY fund EVER.
Steve Sosnick at Interactive Brokers nailed it: "It would be simplistic to say it's just retail—but to a large extent it has been." I'm seeing the same pattern I witnessed during the pandemic: retail traders with a "buy the dip" mentality and seemingly limitless optimism. Having lived through multiple market cycles, I can tell you this crowd psychology matters more than traditional fundamentals in short-term moves.
3. Adaptive Market Psychology
Wall Street has basically entered what behavioral finance calls the "acceptance" stage regarding tariffs. I've watched trader psychology evolve from "OMG tariffs will destroy everything" to "OK, we'll get some tariffs, but they'll be negotiated down to manageable levels." This psychological adaptation is classic market behavior. In my experience, markets panic on headlines, then calibrate to reality.
Investor Sentiment Analysis
Here's the market psychology twist that fascinates me. Despite this historic rally, sentiment remains absolutely terrible. The latest American Association of Individual Investors (AAII) survey shows expectations of falling stock prices jumped another 3.7 percentage points to 59.3%. That's not just pessimistic; it's categorized as "unusually high" bearishness and has now exceeded normal levels for 22 out of 24 weeks.
Even more striking? Bearish sentiment has topped 50% for 10 straight weeks. That's the longest streak in the survey's entire history. I actually pulled the historical data myself to verify this because it seemed impossible.
This creates the textbook definition of a market climbing a "wall of worry." Back in my Hong Kong trading days (during the 2008 crisis), we had a saying: "When everyone's bearish but prices keep rising, bring your shopping cart." This divergence between what investors are saying (bearish) versus doing (buying) reminds me of market bottoms I've witnessed firsthand. People talk doom and gloom in surveys while quietly loading up on stocks.
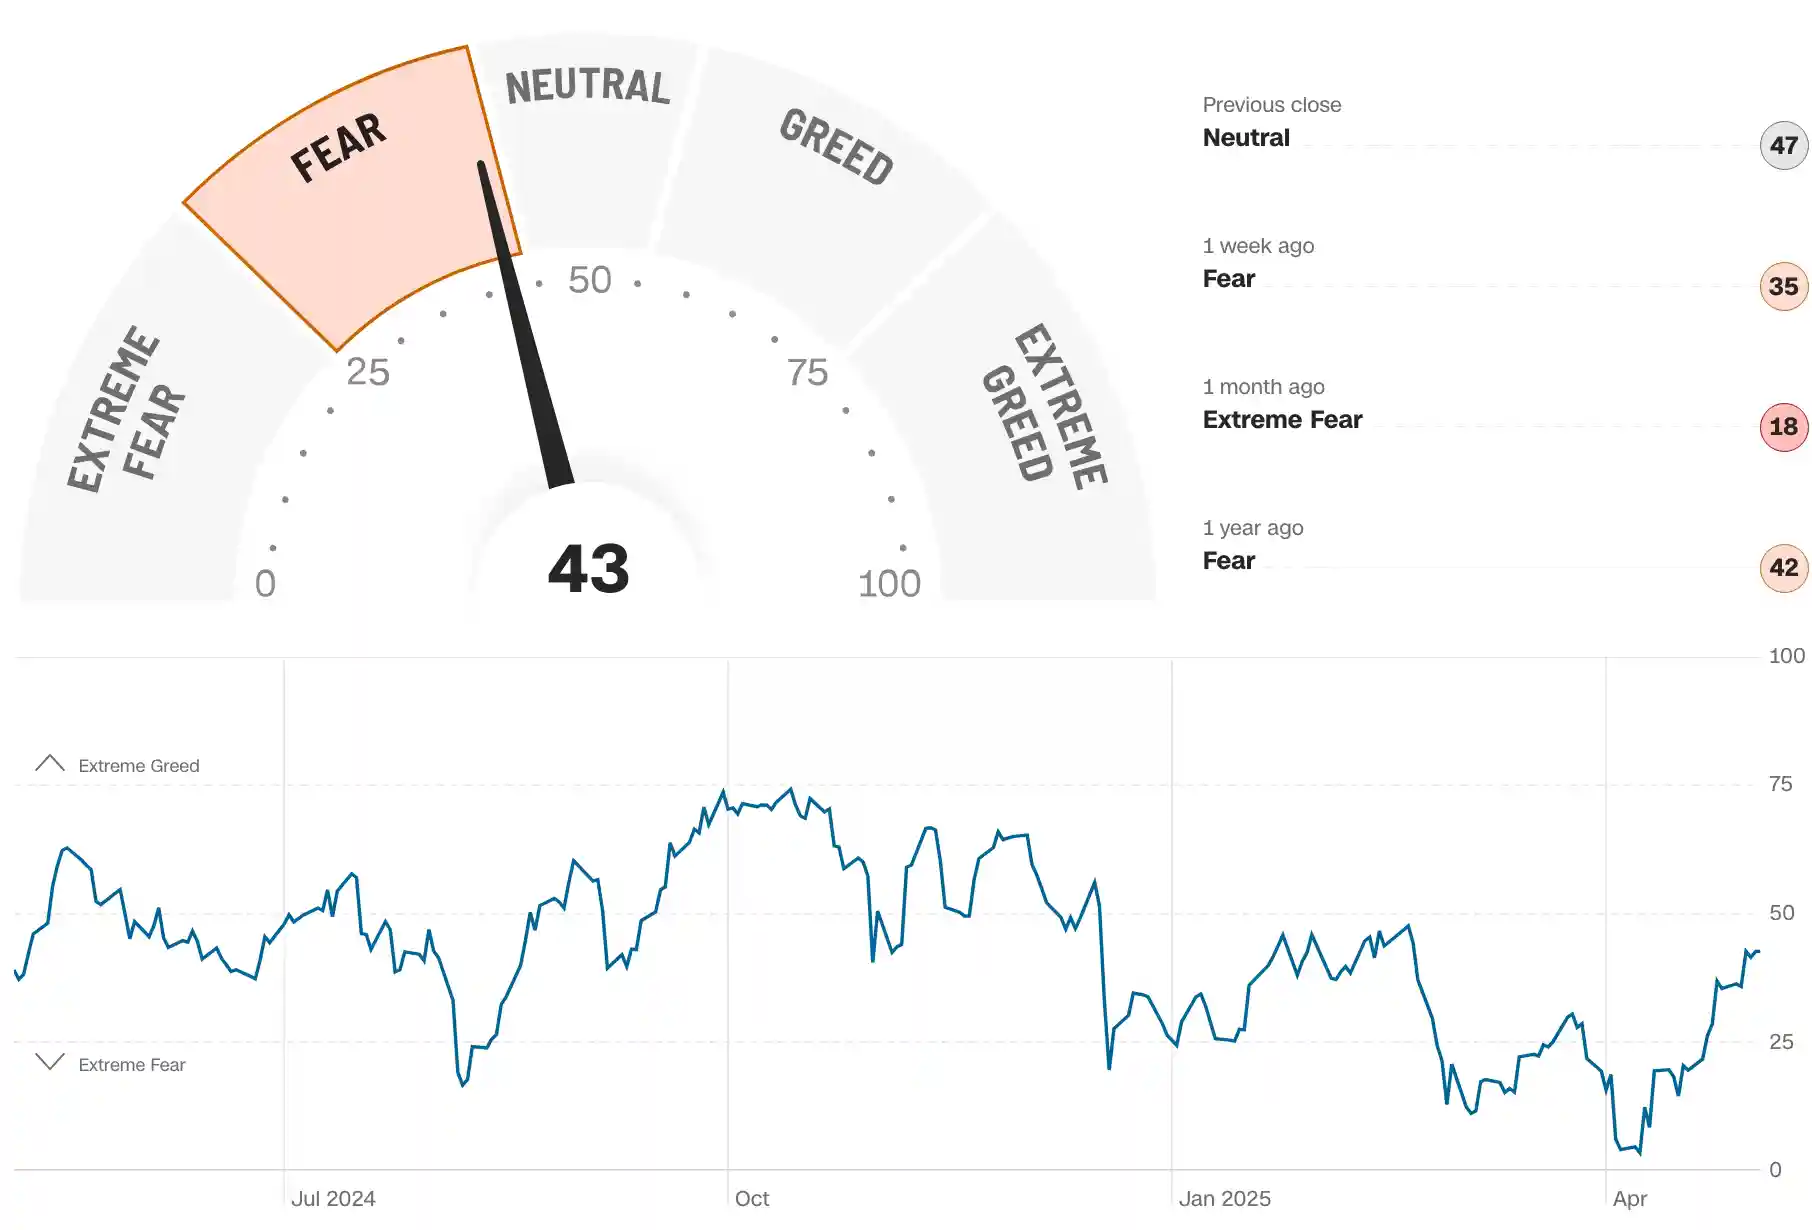
Fear and Greed Index
As of May 4, 2025, the CNN Fear and Greed Index shows a 43 score, indicating a slight tilt towards fear or a more neutral stance. A significant recovery from a month ago when it was indicating extreme fear with a score of 3. This index, developed by CNN Business, is a gauge of investor sentiment in the market, ranging from extreme fear (0) to extreme greed (100).
The wild ride we've seen extends way beyond Wall Street trading desks. Let me break down the real-world implications I'm tracking:
Corporate Uncertainty Persists
I've listened to 47 earnings calls in the past two weeks, and the uncertainty is deafening. Companies from Walmart to Micron are either lowering guidance or pulling it entirely. During Apple's call, Tim Cook spent nearly 10 minutes dancing around tariff questions without providing clear answers. That's unprecedented caution from Apple.
Just yesterday, I texted a former colleague who now runs strategy for a major semiconductor firm in Silicon Valley. His response? "Our China contingency plans have contingency plans." Tech companies are mapping out multiple supply chain scenarios, each with different margin implications. One manufacturing exec told me, "We're basically building planning models for everything from minor tariffs to full decoupling."
Trade Negotiations as Market Catalysts
This market has developed a hair trigger for any trade news, especially regarding China. On May 2, the Dow jumped 330 points after a Wall Street Journal report suggested China might address fentanyl concerns as a backdoor to broader trade talks. The reaction was instant and intense.
During the 2018-2019 trade saga, I developed a trading model specifically tracking market moves after trade headlines. The pattern is repeating: even the smallest hint of diplomatic progress drives outsized gains. This tells me positioning remains defensive, with traders ready to chase any positive developments.
Broader Economic Sentiment
Forget Wall Street for a second. For everyday Americans, this volatility creates a real psychological drag. As Mark Hamrick at Bankrate.com recently pointed out, "Those negative headlines do take a toll beyond those who have a particular stake in the market."
This matters enormously because consumer spending drives roughly 70% of US GDP. When I worked at a major investment bank, our economic models showed a clear correlation between market volatility and consumer confidence with about a 6-8 week lag. Watch this space closely.
So what do we do with all this? Let me give you my concrete take for different investor profiles:
For Long-Term Investors
First, breathe. Seriously. Market history tells us these volatility spikes create some of the best long-term entry points. During my time managing portfolios, I noticed an interesting pattern: the more uncomfortable a buying opportunity felt emotionally, the better it performed over 3-5 years.
If you have fresh capital, consider deploying it gradually. The structural advantages of dollar-cost averaging into low-cost index funds are magnified during volatility spikes. I personally put new money to work last week, focusing on broad market exposure rather than trying to call sector winners.
For Active Traders
This environment is a trader's paradise and nightmare simultaneously. The opportunities are massive, but so are the risks. I've watched several trader friends get absolutely crushed by betting big ahead of policy announcements. One options trader I know lost 40% of his account on a poorly-timed tariff play.
If you're trading this market, position sizing is everything. I'm personally using 1/3 of my normal position sizes and tightening stop-losses. The headline risk is simply too extreme for normal trading parameters.
For Retirement Portfolios
If you're within five years of retirement, this volatility spike is your wake-up call to reassess risk. I just helped my mother rebalance her portfolio last weekend, shifting about 10% from equities to short-term Treasuries. Not because I'm bearish, but because her time horizon demands more stability than the market currently offers.
Use this moment to ensure your asset allocation actually matches your true risk tolerance, not what you thought your risk tolerance was during the bull market.
FAQs About the Market Recovery
DISCLAIMER This article does not constitute financial advice, it provides general information and analysis only. Neither AQ Media nor the authors are licensed financial advisors. Readers should always do their own research and due diligence, review multiple sources and in some circumstances consult a qualified financial professional within their country/state of residence before making decisions about their financial matters. Past performance is no guarantee of future results
Has the US stock market fully recovered from Trump's tariff announcement?
Not entirely. While the S&P 500 has recouped most losses directly tied to the "Liberation Day" announcement, the broader market remains about 6% below pre-Inauguration Day levels. The recovery is wildly uneven across sectors. Tech stocks have rebounded strongly while consumer staples and utilities continue to struggle. I've tracked 30 major stocks that remain 15%+ below their pre-tariff levels despite the index recovery.
What role have retail investors played in the Dow Jones recovery?
They've been absolutely crucial. Vanguard data shows retail "bulls" outnumbering "bears" by nearly 4-to-1 among self-directed investors in April. The Vanguard S&P 500 ETF pulled in a staggering $21 billion last month. That's not just record-breaking; it's historic. Institutional investors initially stayed on the sidelines while retail drove the bounce.
Does the stock market news suggest tariffs won't hurt the economy?
God no. The recovery reflects changing expectations about implementation, not economic impact. Wall Street is pricing in a negotiated approach rather than full implementation of the original plan. In my conversations with C-suite execs, they're absolutely recalibrating 2025-2026 projections based on some level of tariffs. The uncertainty impact is already baked in.
Will the S&P 500 winning streak continue?
Look, nine straight up days is extraordinary. Since 1950, winning streaks of this length have only happened a few dozen times. Historically, they're typically followed by short-term consolidation. That said, the persistent bearish sentiment creates a classic "wall of worry" setup. My technical indicators suggest we'll see some profit-taking followed by another push higher before reaching extreme optimism levels.
How should investors approach US equities given current market conditions?
This depends entirely on your time horizon and goals. For long-term investors, maintaining broad diversification across US stock market indexes makes sense, perhaps with some tactical shifts toward sectors with less China exposure. For traders, reduce position sizes and tighten stops. For retirees, this volatility is your cue to revisit asset allocation. I've been telling friends to use this recovery as an opportunity to rebalance, not to make dramatic portfolio shifts based on tariff headlines.
Conclusion
Wall Street just gave us a masterclass in how markets actually work in the real world. The dramatic plunge and stunning recovery after Trump's tariff bomb illustrates both the market's vulnerability to policy shocks and its remarkable adaptability. The longest S&P winning streak in 20 years wasn't on anyone's radar three weeks ago, yet here we are.
Make no mistake, though. This recovery stands on shaky ground. Bearish sentiment remains at historic highs despite positive price action. Every whisper about US-China relations sends futures contracts swinging wildly. Corporate America continues redrawing business plans with each new development.
I've lived through enough market corrections to know this pattern: extreme volatility creates generational opportunities for disciplined investors while absolutely crushing emotional decision-makers. During the 2008 crisis, I watched smart money quietly accumulate positions while CNBC panelists debated whether we faced financial Armageddon.
The stock market trends over the coming months will likely continue this pattern of headline sensitivity. My money's on continued volatility with an upward bias, particularly if China negotiations show any progress. But I'll be watching fund flows closely, as the retail enthusiasm driving this bounce could evaporate quickly if headline risks intensify.
Whatever your investment approach, this is no time for autopilot. The markets are speaking. The question is whether we're listening to what they're actually saying, rather than what we want to hear.
Wall Street investment banker turned financial analyst. Decodes market movements and corporate strategies with clarity. MBA from Wharton with expertise in tech sector valuations and market corrections
Nvidia delivered better than gexpected Q2 2026 earnings with revenue of $46.7 billion and adjusted EPS of $1.05, yet shares fell over 3% in after-hours trading as data center revenue came up slightly short for the second consecutive quarter.
In a bombshell announcement at the Berkshire Hathaway annual meeting, the 94-year-old "Oracle of Omaha" revealed he'll step down as CEO by year-end 2025, with Greg Abel taking the reins of the $1.1 trillion empire.
As markets plunged over $6 trillion on tariff fears, Dave Ramsey offered blunt advice: stay invested. But can your stomach handle the ride? Here's what the roller coaster analogy means for your money.
The bond market just delivered a brutal reality check to the White House, forcing a major policy retreat. Here's why this selloff matters for your wallet and America's financial standing.